Reachability Analysis
Your rule has 47 rows. Which ones actually matter?
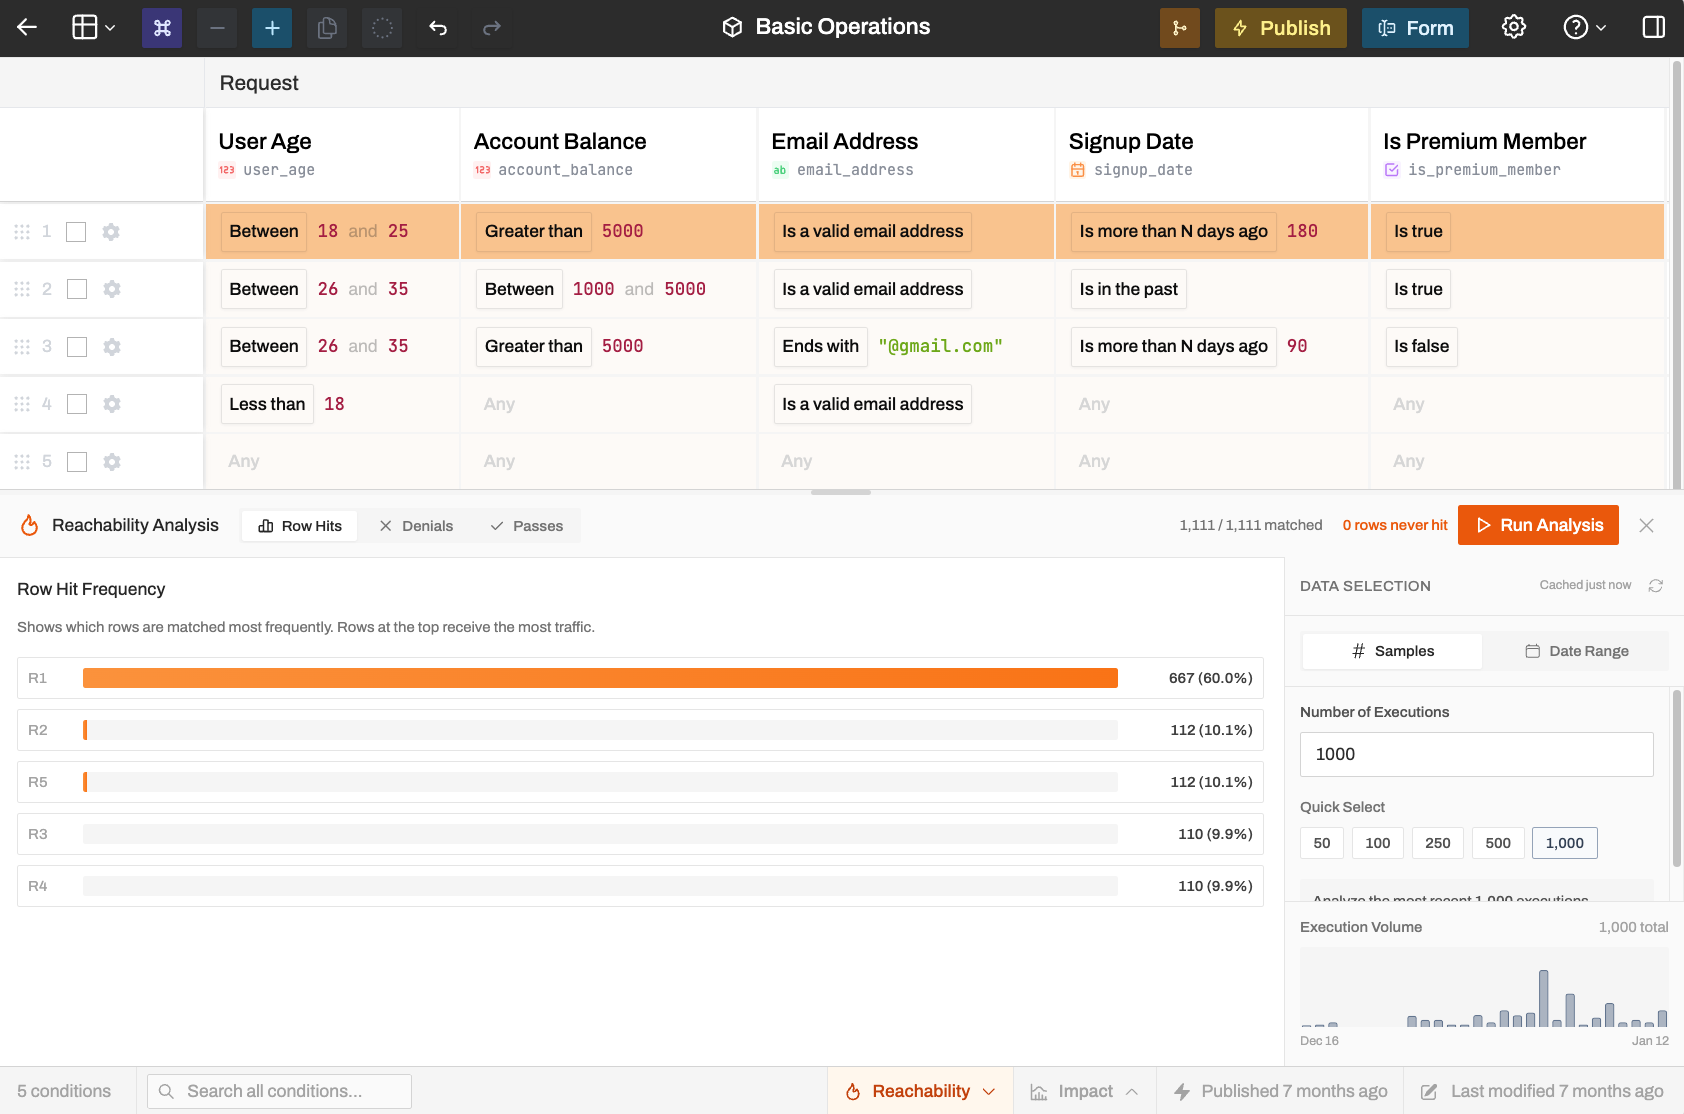
Reachability Analysis shows you exactly which rows are being hit by real traffic—and which ones might be dead weight. It analyzes your execution logs to surface usage patterns you wouldn't otherwise see.
What It Shows
Which rows are doing the heavy lifting:
- Rows sorted by hit frequency, most matched at top
- Percentages showing traffic distribution
- Rows that were never hit flagged as potential dead code
The panel header shows summary stats: how many requests matched at least one row, how many matched nothing, and how many rows have zero hits.
High "no match" counts mean inputs are falling through without being handled. You probably need a catch-all row or broader conditions.
Finding Dead Rows
A row with 0% hits over 30 days is probably:
- Unreachable — an earlier catch-all row blocks it
- Obsolete — handles an edge case that never actually occurs
- Safe to remove — cleaning up your rule table
Before deleting, make sure to thoroughly investigate why it's not being hit. Some rows handle rare but critical cases— you don't want to remove your fraud detection row just because it only fires twice a month.
Performance Optimization
If one row handles 80% of your traffic but sits at the bottom of your table, moving it up can meaningfully improve evaluation speed at scale. Rulebricks evaluates top-to-bottom, so putting your high-traffic rows near the top reduces unnecessary condition checks.
Use Impact Analysis afterward to verify that reordering didn't change your rule's behavior.
Large Reports
Computation is handled on our servers– but we encourage users to be prudent about the sample sizes they use as particularly large requests may take several minutes to complete and potentially timeout.
We perform cardinality analysis on your rule internally to optimize reachability reports for massive amounts of data/rows.